The simple way to use a breakpoint in Xcode is just to click on the line number next to the line of code that needs to be debugged and start to step through the code. But an action can also be added to the breakpoint to speed up the debugging. This post covers three out of the six available actions, as those are the ones i felt are most useful.
To add actions to a breakpoint click on it while holding option(alt) + command When the breakpoint settings are open you click on add action.
Debugger command
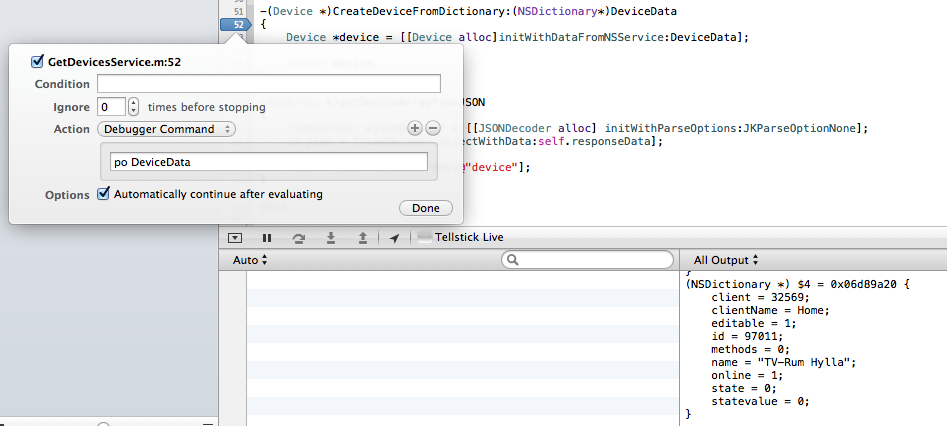
A debugger command is useful when wanting to know what values an object holds while the breakpoint is hit. We can use it to print the values to the debugger output without having to step through the code or write code to output it with NSLOG.
- Edit a breakpoint using the shortcut above and select debugger command as action.
- In the textbox that shows up a debugger command can be entered. like po foo. foo is changed to a object in the scope of where your breakpoint is located.
- Also check the “automatically continue after evaluating” checkbox as we don’t want to stop at this breakpoint.
In the example below I have a breakpoint which outputs the values of a NSDictionary called DeviceData to my debugger window.
Log Message
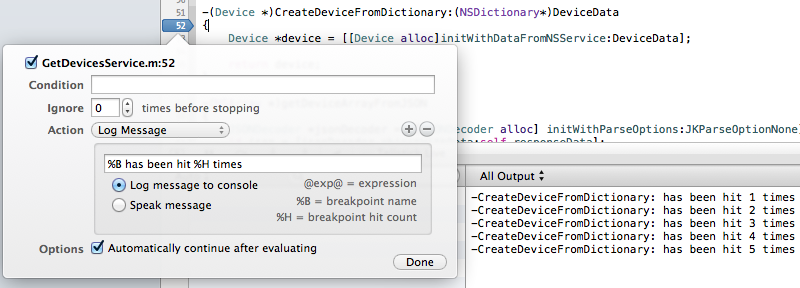
You can also log a message to the debugger console, if you for example want to know how many times a breakpoint is being hit.
- To do this select Log message in the action dropdown
- Select “Log message to console”.
- Type “_%B has been hit %H_ times”
- And as we did before we check the “Automatically continue after evaluating”
Sound
This action can be used if we are only interested in to see if a message is sent to a method when we run our project.


